← Practical AI for the built environment
Spatial Analytics
The grammar of space, extended by AI.
Space syntax gave architecture a measurable language for movement: integration, choice, isovists, natural movement. We treat that language as the precursor and use AI to read what the graph alone cannot: heat, shade, material, and the street as people actually experience it.
Configuration first: the space syntax core
Bill Hillier's insight still holds: layout itself is the primary generator of movement. We build that baseline rigorously before any AI enters the pipeline.
Network analysis
Axial and segment models of buildings, campuses, and streets, computed in DepthmapX and Grasshopper based workflows.
- Axial maps and segment angular analysis
- Integration and choice at multiple radii
- Visual graph analysis and isovist fields
Natural movement, measured
Configuration predicts a majority of pedestrian flows. We benchmark model output against observed movement so the numbers stay honest.
- Gate counts and observation protocols
- Correlation benchmarks against predictions
- Clear reporting of what the model explains and what it misses
Where the graph goes blind, AI keeps reading
An axial map is identical with or without trees, arcades, or afternoon heat. Whatever those do to movement lands in the residual. That is exactly where we point the machine learning.
Environmental coupling
Microclimate variables joined to the spatial graph, so thermal comfort becomes a first-class spatial parameter.
- Thermal comfort mapping (PET) and radiation studies
- Shading geometry, canopy, and arcade conditions
- Sky view factor and urban heat island metrics
Headed AI
Machine learning enlarges the variable set and tests design options underneath, while every decision stays verifiable in Rhino and Revit.
- Learning models on enriched spatial plus environmental data
- Generative options in Dynamo and Grasshopper
- Architect-verified outputs, never black box hand-offs
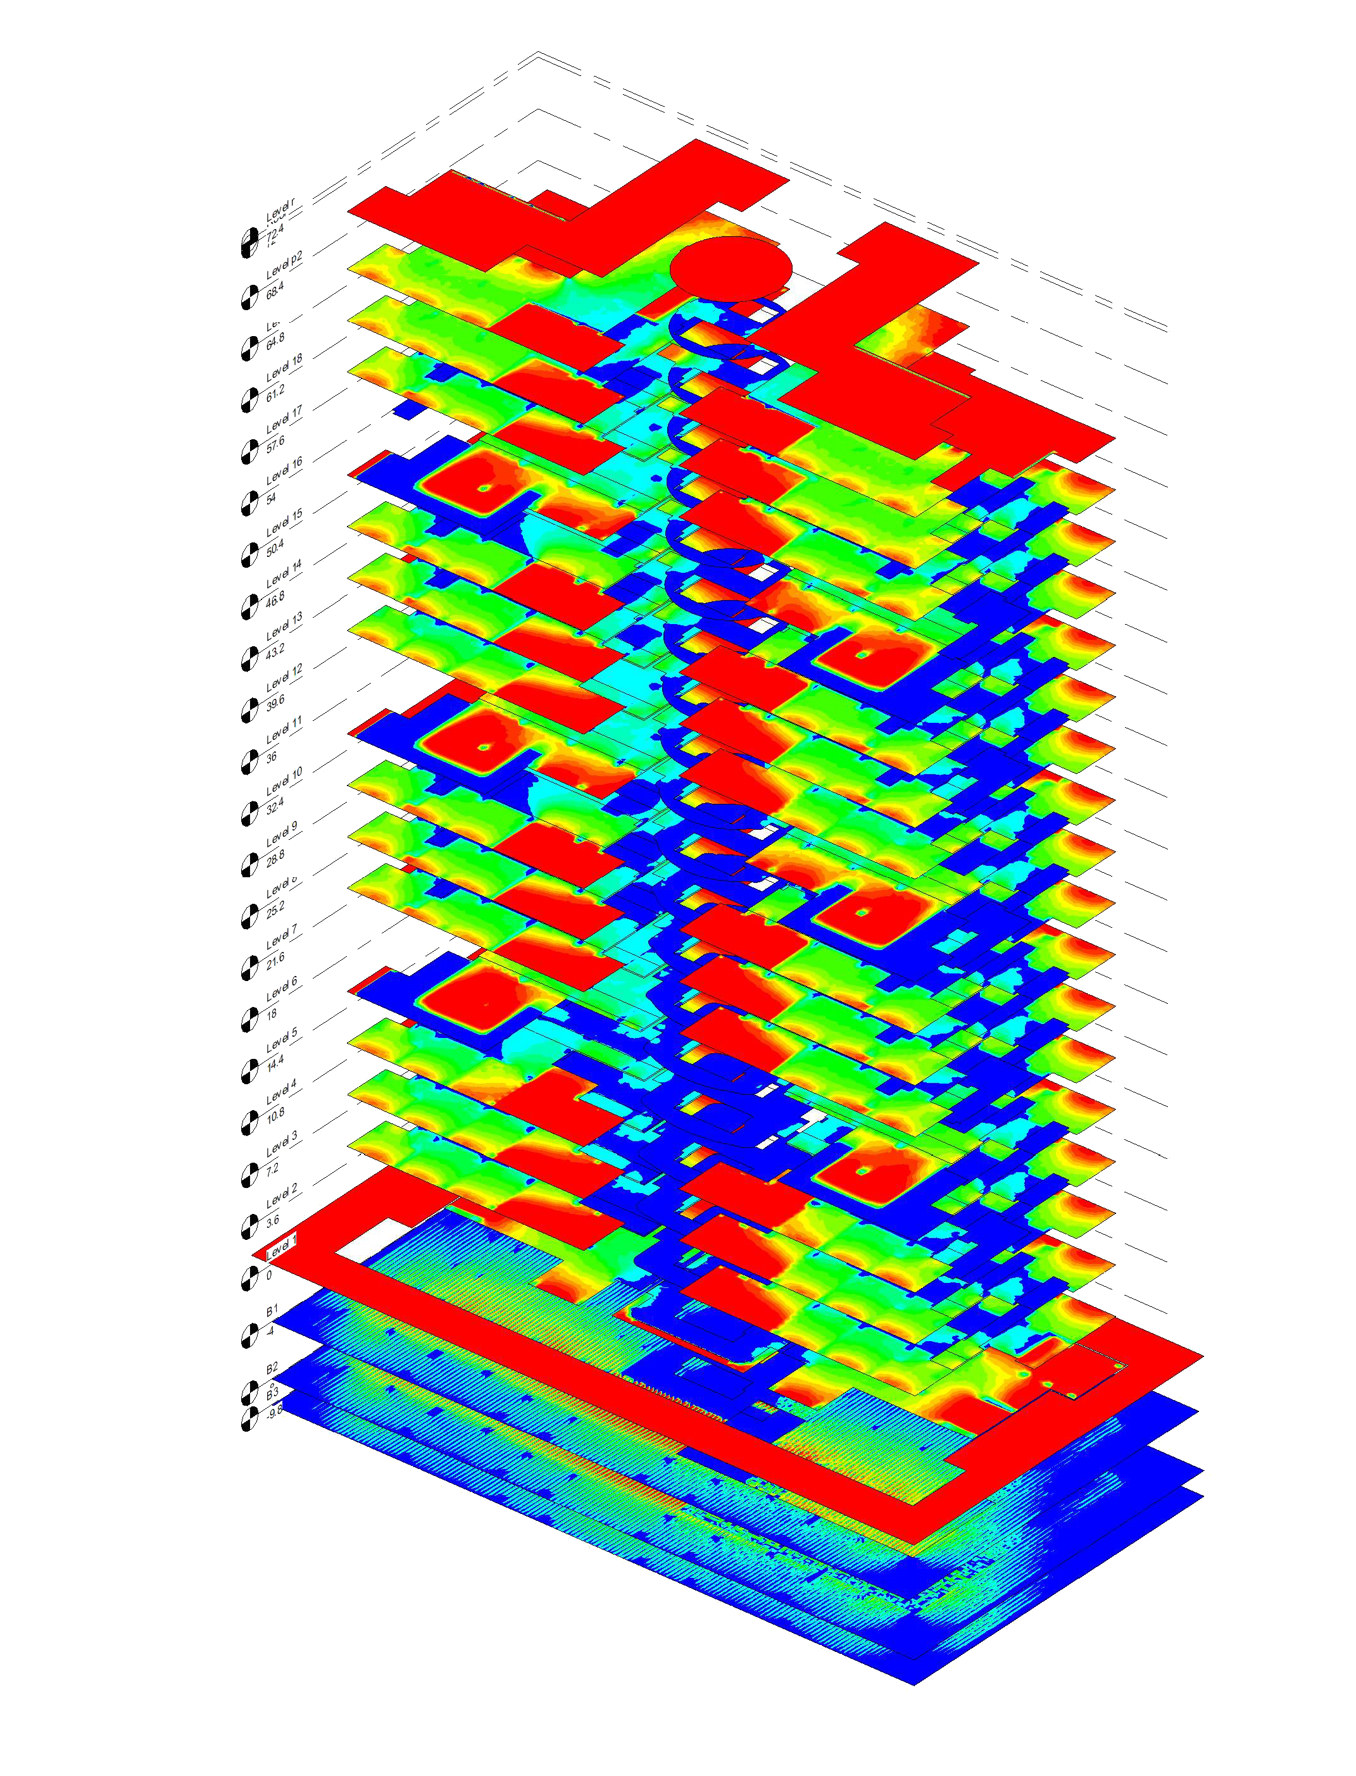
Applied spatial analysis
For masterplans, campuses, retail, and public space: analysis that answers where people will walk, stop, and gather, and design moves that change the answer.